Talking Charts, is among the top 3 winners of the ICT 4 Inclusion Challenge organized by Atos, the German Federal Ministry for Economic Cooperation and Development (BMZ), GIZ, and Make-IT Alliance.
The theme of the 2021 challenge was towards shaping inclusive education for people with disabilities in Africa. The awards were held on the December 3rd 2021, on the International Day of People with Disabilities.
Challenge Website : https://ict4inclusionchallenge.org
Press Release : https://atos.net/en/2021/press-release_2021_12_03/winners-of-first-ict-4-inclusion-challenge-in-africa-announced?s=09/
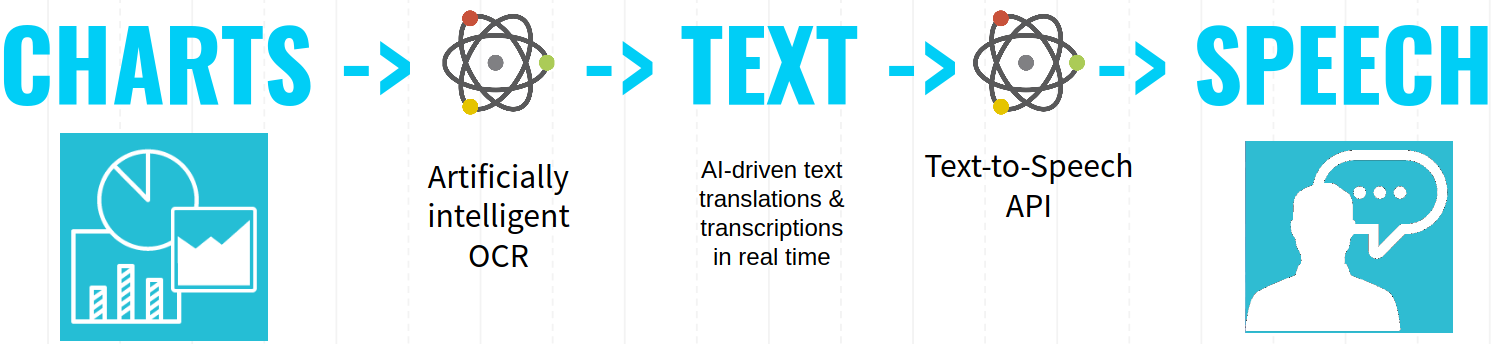
TalkingCharts is an online tool that makes graphical data visualizations easily accessible to the visually impaired and the blind.

It uses a machine learning algorithm to identify, categorize and transcribe data visualizations such as charts, graphs and infographics into machine-readable text. This text description of the graph is then converted into a high fidelity synthetic speech that can be listened to and interacted with.
The project is based on research in evaluating the effectiveness of the use of speech in data exploration for the visually impaired.
| Name | Eric Wamugu Maina | |
|---|---|---|
| Univeristy | African Leadership University | |
| Course | Global Challenges | |
| Research Interests/Areas | Data visualization and Interaction, Immersive Analytics, Human-computer interaction, Natural Language Processing, Tech Policy | |
| Social Profiles | GitHub | |